


 40 / 203

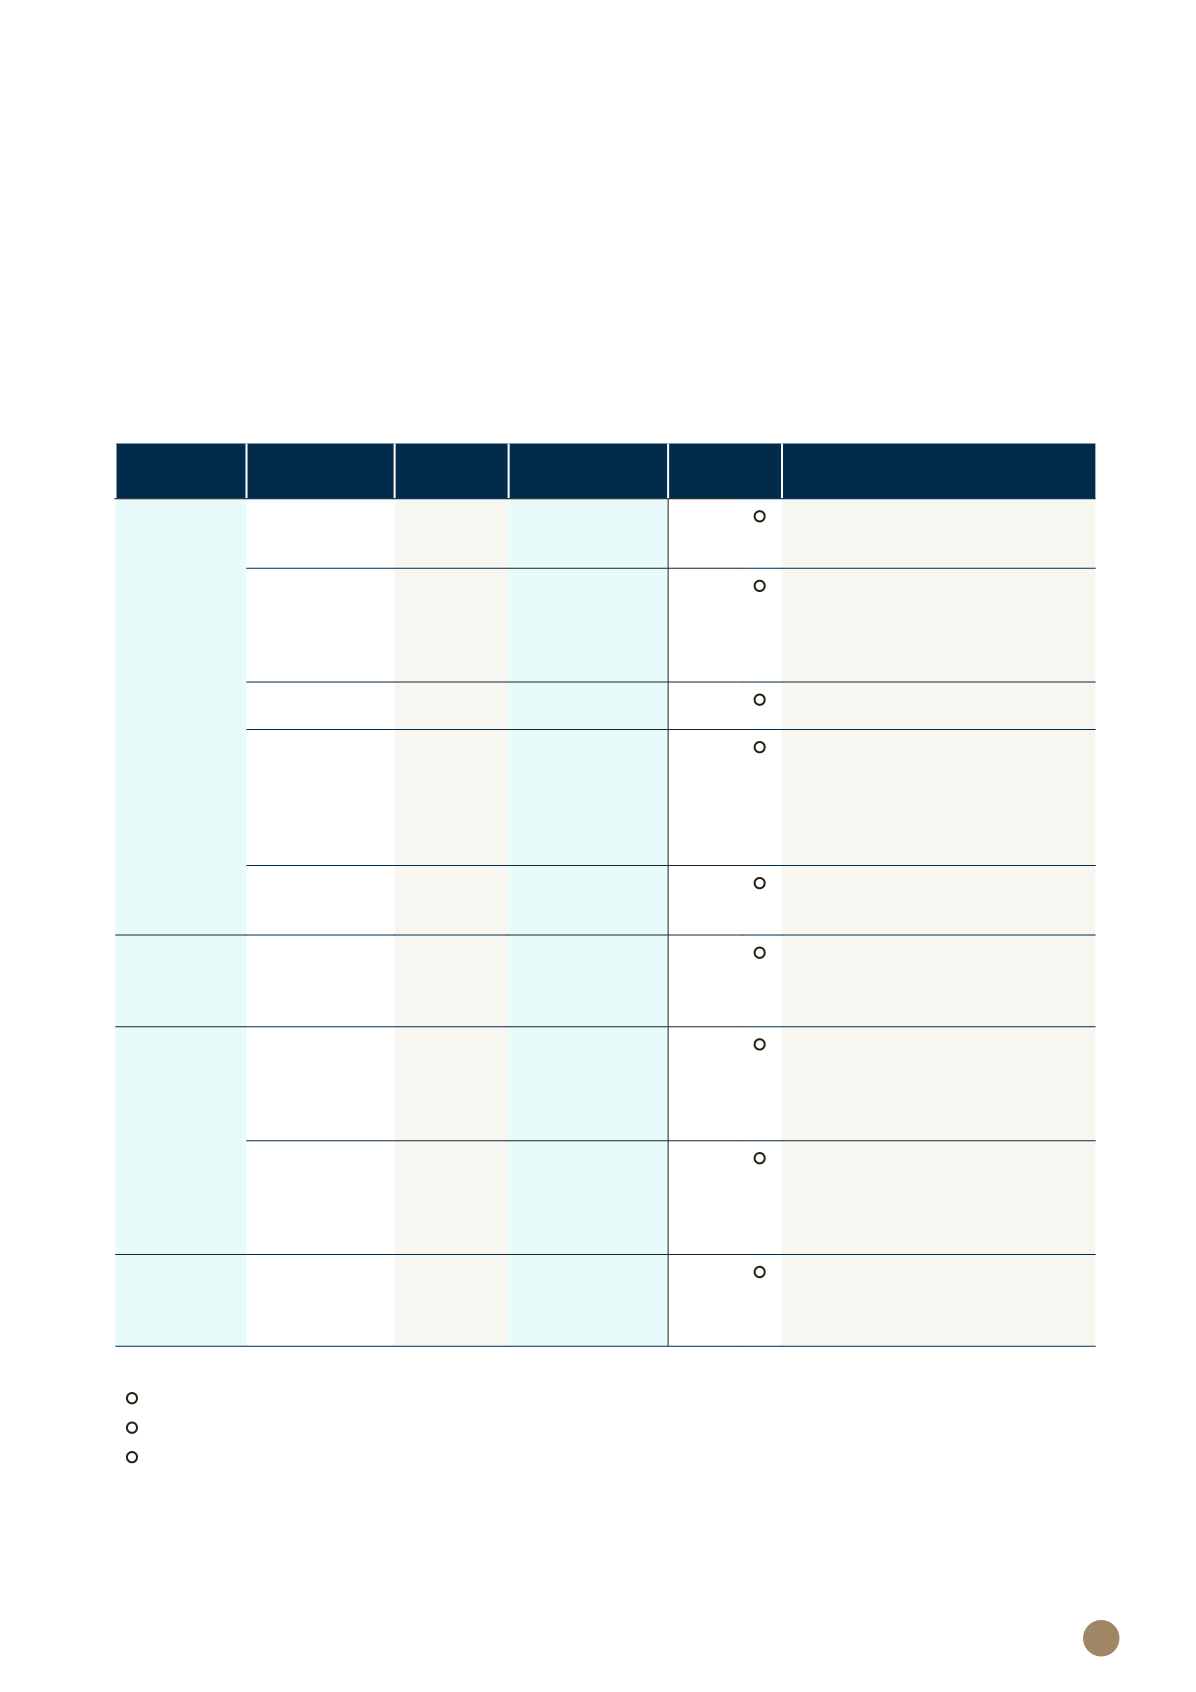
KEY PERFORMANCE
INDICATORS (KPI’S)
The performance of our management and staff is measured on a balanced scorecard basis with an equal weighting
for both financial and non-financial measures.
The KPI’s are categorised under mutuality, financial stability, service and staff, which in turn tie back to our key
strategic priorities for the Group.
HOW DID WE DO IN 2018?
OUR KEY
KPI'S
Unit of
measure
2018
PERFORMANCE
2018
GOAL COMMENTARY
FINANCIAL
STABILITY
Gross premium
income
Rand
billions
4.5
4.6
G
Gross premium income (long-term
and short-term) is slightly below
expectations.
Total assets*
Rand
billions
34.9
39.0
R
Total asset growth expectation is
measured over a three year rolling
period. Total assets is below the
goal due to negative investment
returns from markets in 2018.
Efficiency ratio
%
14.7
15.2
G
Cost control remains an imperative
of the Group.
New annual
premiums
Rand
millions
588.2
593.7
Y
New long-term risk premiums are
in line with prior year, but below
the internal target. The economic
environment in South Africa has
proven to be challenging for the
consumer in 2018.
New
investment
inflows
Rand
billions
5.9
5.3
G
Performance is significantly up on
prior year, and ahead of internal
target.
MEMBERSHIP
Number of
new members
recruited
during the year
Individuals
6 931
7 961
R
New member recruitment
performed below target in 2018.
SERVICE
Claims
processed
within
Service Level
Agreement
%
100.0
97.5
G
PPS aims to provide members
with world-class service. Claims
processing targets were exceeded
during the year.
Customer
satisfaction
survey results
Rating
97.8
> 80
G
Members are satisfied with our
service. The rating is based on
two important levers of service:
professionalism and first time
resolution.
STAFF
Training
spend as a
percentage of
payroll
%
6.0
> 5.2
G
Training spend is ahead of target.
* Excluding assets in unit trusts for third parties.
G
Achieved
Y
Partly achieved
R
Not achieved
39